Support and Resistance: Determine the Trading Range
What is resistance?
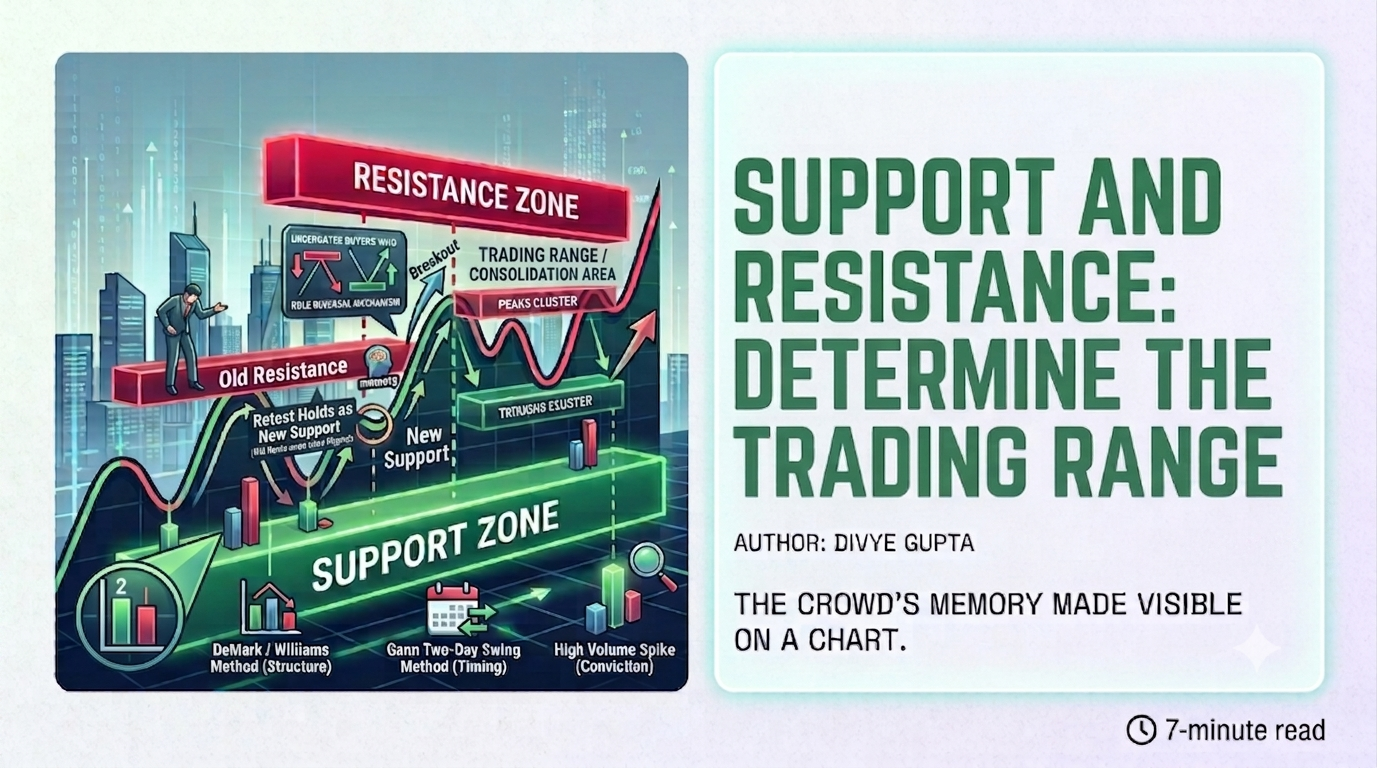
Resistance forms when prices have been rising and then reverse downward. The highest point of that advance — the peak — is the resistance point: a level at which the advance met selling resistance strong enough to halt it. At that price, sellers became as powerful and as aggressive as the buyers who had been driving the rally, and the balance tipped.
A single high-volume price peak often defines a resistance point cleanly. But high volume at a peak, especially one preceded by a sharp price rise, is rarely a sign of calm, rational trading. It is usually a sign of speculation and emotion — the moment the crowd's enthusiasm peaked, and with it, the buying pressure that had been pushing price higher.
What is support?
Support is the mirror image of resistance: a single trough. At this point, buyers become as powerful or as aggressive as the sellers and halt a price decline. Where resistance marks the ceiling of crowd optimism, support marks the floor of crowd capitulation.
Zones are memory, not accident
Support and resistance only matter because of a simple assumption: that prices will tend to stop at these same recorded levels again in the future. These zones are not arbitrary lines on a chart — they represent a remembered psychological barrier. Traders who bought at a level and watched it hold as support remember it. Traders who sold at a level and watched it cap every rally remember it too.
Support and resistance are not lines you draw once and forget. They are a live record of where the crowd has already fought — and a working hypothesis for where it is likely to fight again.
That collective memory is what gives a zone its power, and it is why these zones often carry through time, continuing to act as barriers to future price action long after the original trade that created them has closed. The most important behaviour to understand is what happens once a zone is broken. Support and resistance are not permanent — they switch functions. Once broken, previous support becomes new resistance, and previous resistance becomes new support. The logic is behavioural, not mechanical: traders who bought at a support level that later breaks down are now underwater and eager to sell the moment price recovers to their entry — turning what was once a floor into a new ceiling. These are not abstract technical rules; they are the direct, visible trace of the crowd's memory and regret.
Determining the trading range
Trading ranges occur when peaks and troughs appear at roughly similar levels over time. The peaks cluster near a certain price, and the troughs cluster near a certain price below them — price oscillates between the two without committing to a clear trend. This structure is also known as a consolidation, a congestion area, or a rectangle formation, and it typically signals a standoff between buyers and sellers at both extremes of the range.
To construct a support zone, draw a horizontal line through each significant trough and project it into the future; the same applies to resistance, drawn through each significant peak. In practice, previous troughs rarely occur at exactly the same price, so rather than a single hard line, the more useful construct is a zone — bounded by the highest and lowest of the relevant horizontal lines. That zone, not a single price tick, is what actually defines the support or resistance area, and by extension, the trading range itself.
How to determine important reversal points
Identifying the reversal points that anchor these zones is where technique matters. Three methods are widely used.
DeMark or Williams method. For a low bar, the analyst looks for at least two bars — using closing price — on either side of the suspected trough that show higher lows, using the day's lowest price as the reference. The mirror version applies to a high bar, looking for lower highs on either side using the day's highest price. A genuine trough should be flanked by bars that failed to make a new low, confirming that buyers stepped in and held the level.
Gann two-day swing method. A faster, more mechanical variant. To confirm support, identify the low bar and then observe the two trading days that follow. If both of those days post a higher high than the low bar's closing price, the low bar can be marked as a confirmed support point. The same logic runs in reverse for identifying resistance from a high bar.
High-volume method. Unusually large volume itself acts as a signal, because it reflects a moment where a large number of participants were willing to transact at that price — either capitulating or piling in. One-day and two-day volume patterns at peaks and troughs, when combined with high-volume bars, are frequently reliable markers of a reversal. In some cases the daily chart alone will not be precise enough, and the actual price level at which the reversal took place needs to be confirmed by inspecting intraday action.
None of these methods is meant to be used in isolation. A trough confirmed by the DeMark method that also shows an unusually large volume spike carries more weight than either signal alone. The goal is not certainty — support and resistance are zones of probability, not guarantees — but a reasonable basis for where the crowd is likely to defend its previous decisions.
What this means for your trading
Support and resistance are not lines you draw once and forget. Treat every zone as provisional: valid until broken, and immediately reassigned a new role the moment it is.
- Draw zones, not lines. A single price level rarely holds exactly — give every support or resistance area room to breathe.
- Watch what happens at the retest. When old resistance breaks and price pulls back to test it as new support, how it behaves there tells you far more than the breakout itself did.
- Weight your confirmation. A reversal point confirmed by price structure, timing, and volume together is worth more than any single signal in isolation.
- Respect the break. The move that finally clears a well-respected zone is often the start of the next meaningful trend, not a fakeout to fade.
Every support and resistance zone is a record of a fight the market has already had. Your job is not to predict the next fight — it's to recognise when the crowd is standing at the same battle line for a second time.
Put this pattern to work in your own journal.
Start free trial →