Double Top and Double Bottom
The simplest reversal on the chart
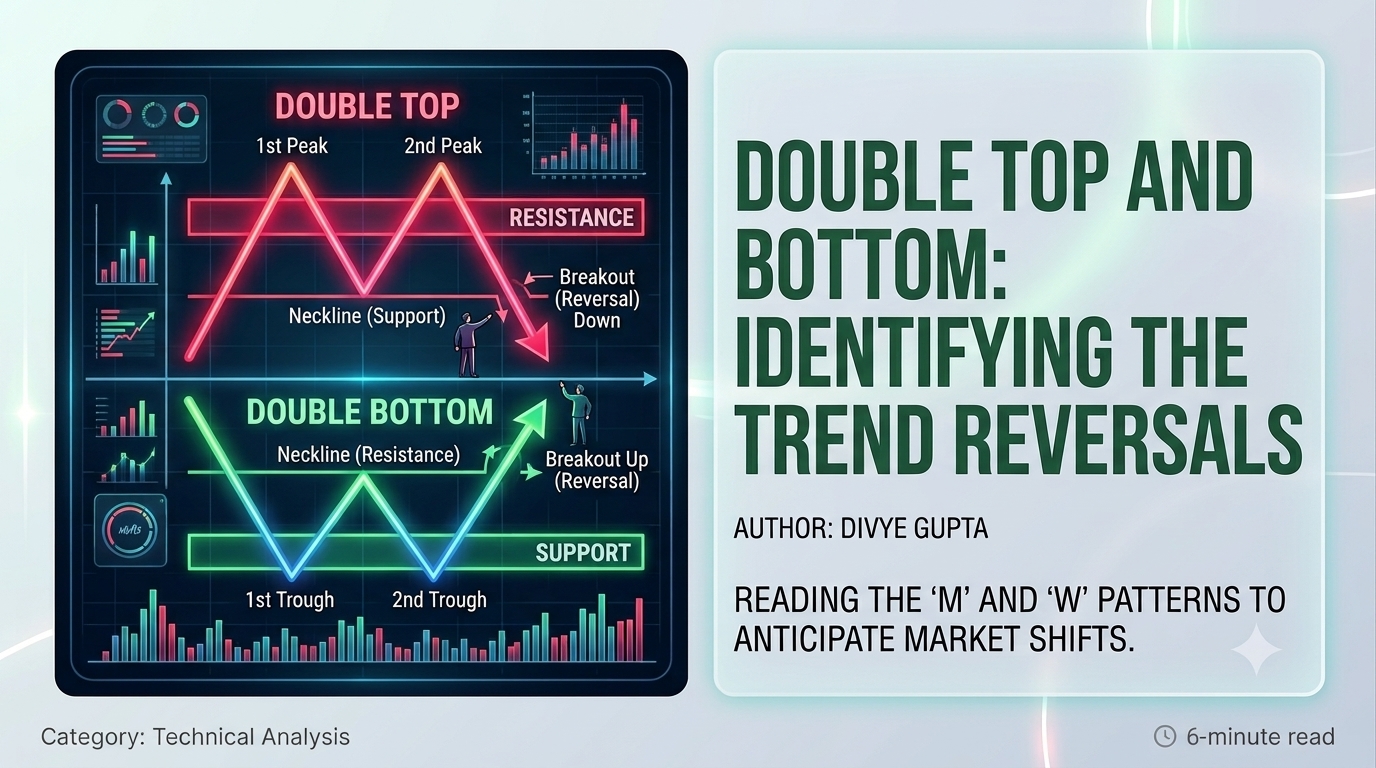
A double formation is one of the most stripped-down reversal patterns in technical analysis. It is built from just three reversal points: two peaks separated by a single trough. That is the entire skeleton — two attempts at a high, a valley in between, and a decision about which way price finally commits.
The setup only qualifies as a double top when the geometry lines up. Price must enter the pattern from below the trough — that is, on the way up — carve out two peaks, and then confirm the reversal by breaking down through the low of the trough that sits between them. Until that breakdown happens, there is no pattern. There is only a shape that might become one.
A double top is not two peaks. It is two peaks plus a confirmed breakout below the trough between them. Everything before the breakout is a guess.
The double bottom: a mirror image
Flip the double top upside down and you have a double bottom. Instead of twin peaks it shows twin troughs, and instead of signalling exhaustion at the top it signals exhaustion at the bottom.
The mechanics invert cleanly. Price enters the pattern from above — on the way down — bounces off a first low, rallies to an intervening peak, falls back to a second low near the first, and then confirms the reversal by breaking up through that intervening peak. The buy signal is the upside breakout, not the second bounce. Same three reversal points, same reliance on confirmation, opposite direction.
The rules that make it valid
A shape that loosely resembles a double formation is not a double formation. A handful of measurable conditions separate the tradeable pattern from wishful pattern-matching:
- The two peaks (or bottoms) must sit at or within 5% of each other's price level. Twin turning points that diverge more than that are describing something else.
- The valley between them should be roughly 10% away from the highest peak (or the intervening peak should be roughly 10% above the lowest bottom). Too shallow and there is no meaningful pullback; the market never actually changed its mind.
- The pattern typically forms over two to seven weeks. Duration matters, and not in the way most traders assume: the longer the formation drags on, the less reliable it tends to be. A crisp, decisive double reverses conviction faster than a sprawling one.
These are guidelines, not laws etched in stone — but the further a candidate strays from them, the more you are trading a hopeful drawing rather than a documented edge.
The premature-entry trap
Here is the single most expensive mistake traders make with this pattern: they act on the shape before the shape is confirmed.
It is enormously tempting. You see two matching peaks, you feel certain the top is in, and you sell — or you spot two matching bottoms and buy the second bounce. The problem is that in Thomas Bulkowski's large-sample research on chart patterns, roughly 64% of apparent double formations never reach the breakout level at all. Price stalls, turns, and resumes its original trend, leaving the "pattern" as nothing more than a pause. The twin peaks you were sure marked a top were just a rest stop on the way higher.
But the story flips completely once confirmation arrives. When the pattern does complete with a genuine breakout through the trough low — or above the intervening peak — it becomes reliable, with a failure rate of only about 11%. That is the difference the breakout makes: from a coin flip that mostly disappoints to one of the higher-quality signals available. In Bulkowski's ranking of chart patterns, the strongest variety of the double formation sits near the very top — roughly the second-best-performing pattern out of the twenty-one he catalogued.
The lesson is blunt: the breakout is not a formality you can front-run. It is the entire signal. Everything before it is a maybe with a 64% chance of embarrassing you.
Adam and Eve: why the shape of the turn matters
Not all double formations are built the same, and the shape of each turning point carries information. Chart analysts describe the peaks and bottoms in two flavours:
- Adam — a narrow, sharp, pointed turn. Price spikes to the extreme and reverses quickly, often on a single dramatic bar.
- Eve — a wide, rounded, gently curving turn. Price lingers near the extreme, rounding over rather than snapping back.
Mixing and matching these gives four combinations, and they do not perform equally. The best-performing double top is the Eve & Eve variety — two rounded peaks. Rounded turns reflect a slower, more deliberate shift in conviction, and that thoroughness tends to produce a cleaner, more durable reversal than a violent spike that can reverse just as fast as it formed.
One more tell: volume usually runs heavier on the first turn than the second. That fading participation on the second attempt is the crowd quietly running out of enthusiasm for the prevailing trend — exactly the exhaustion a reversal pattern is supposed to capture.
Four observations before you act
If you spot a developing double formation, run through this checklist before committing capital. Each item is a small filter, and together they meaningfully tilt the odds in your favour:
- Never act until the breakout has occurred. This is the rule that overrides all the others. No confirmation, no trade — full stop.
- Look for a flat base either at the same level as the twin bottoms or slightly higher and forming earlier. A prior shelf of support reinforces the level the pattern is turning on.
- Look for an absence of a consolidation zone above the formation. Overhead congestion is stored supply — sellers waiting to get out at break-even — and it can smother a breakout before it travels far. Clear air above gives the move room to run.
- Favour the Eve & Eve variety, and check the volume signature. Two rounded turns with heavier volume on the first turn than the second is the classic high-probability configuration.
What this means for your trading
The double formation is seductive precisely because it is easy to see and hard to trade. The shape shows up constantly; the confirmed, tradeable version is far rarer. Your entire edge lives in the discipline to wait for the breakout that separates the 64% of fakes from the 11%-failure real thing.
A few practical anchors:
- Let the breakout be your trigger, never the second peak or second bottom. Mark the confirmation level — the trough low for a top, the intervening peak for a bottom — and let price cross it before you commit.
- Measure the pattern against the rules. Peaks within 5%, a valley around 10% deep, and a formation window of two to seven weeks. The tighter the fit, the better the odds.
- Prefer rounded, Eve & Eve turns with fading volume on the second attempt. Shape and participation are free confirmation on top of the breakout.
- Scan for clear air above (or below) the pattern. A breakout into overhead supply is a breakout on a short leash.
- Log every double you trade in your journal — the shape, the confirmation level, whether it held, and how it resolved. Nothing exposes a habit of jumping the gun faster than your own recorded history.
The pattern does not make you money. The confirmation does. Learning to sit on your hands until the breakout is the whole discipline — and it is exactly the discipline most traders cannot bring themselves to keep.
Put this pattern to work in your own journal.
Start free trial →